Objective
View and record the weather at my home
Method
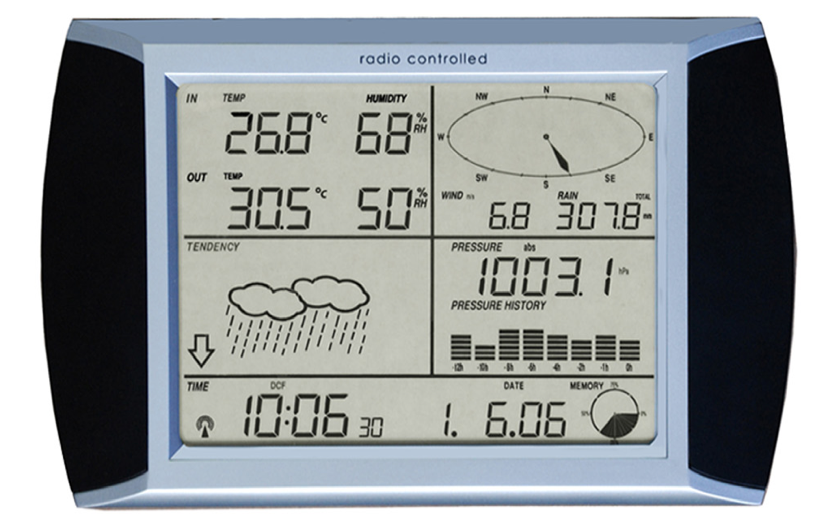
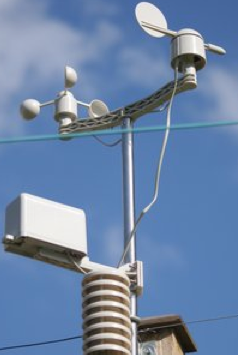
I purchased a "SVP WH1080PC Wireless Touchscreen Weather Station with PC Interface" from Fine Offset Electronics Co Ltd
Objective
View and record the weather at my home
Method
I purchased a "SVP WH1080PC Wireless Touchscreen Weather Station with PC Interface" from Fine Offset Electronics Co Ltd
It has PC software for the PC connected to it by USB but I wantd to use a nslu2 running Debian Linux
Various people have published Linux software for this purpose but most were very tricky to set up.
pywws proved the one that finally worked. It is written in Python and also made me aware of gnuplot
that allows data to be presented as a png file that can easily be incorporated into a web page
My system goes through the following steps - note that when the nslu2 reads data from the weather station it it only takes the data that has been created since the last download
Download the raw weather data from station and save in the archive folder pywss-data
python /home/graham/pywws/pywws-12.02_r487/pywws/LogData.py -vvv /home/graham/pywws/pywss-data
Process the stored data
python /home/graham/pywws/pywws-12.02_r487/pywws/Process.py /home/graham/pywws/pywss-data
Create graphs from the data
python /home/graham/pywws/pywws-12.02_r487/pywws/Plot.py /home/graham/pywws/pywss-data /tmp /home/graham/pywws/pywws-12.02_r487/example_graph_templates/24hrs_full_features.png.xml /var/www/processed-weather-data/24hrs_full.png
python /home/graham/pywws/pywws-12.02_r487/pywws/Plot.py /home/graham/pywws/pywss-data /tmp /home/graham/pywws/pywws-12.02_r487/example_graph_templates/7days_full_test.png.xml /var/www/processed-weather-data/7days_full_test.png
A script runs the above in sequence
#!/bin/sh echo "getting raw weather data from station" echo "processing the stored data" echo "creating png graphs from the data" echo "done" |
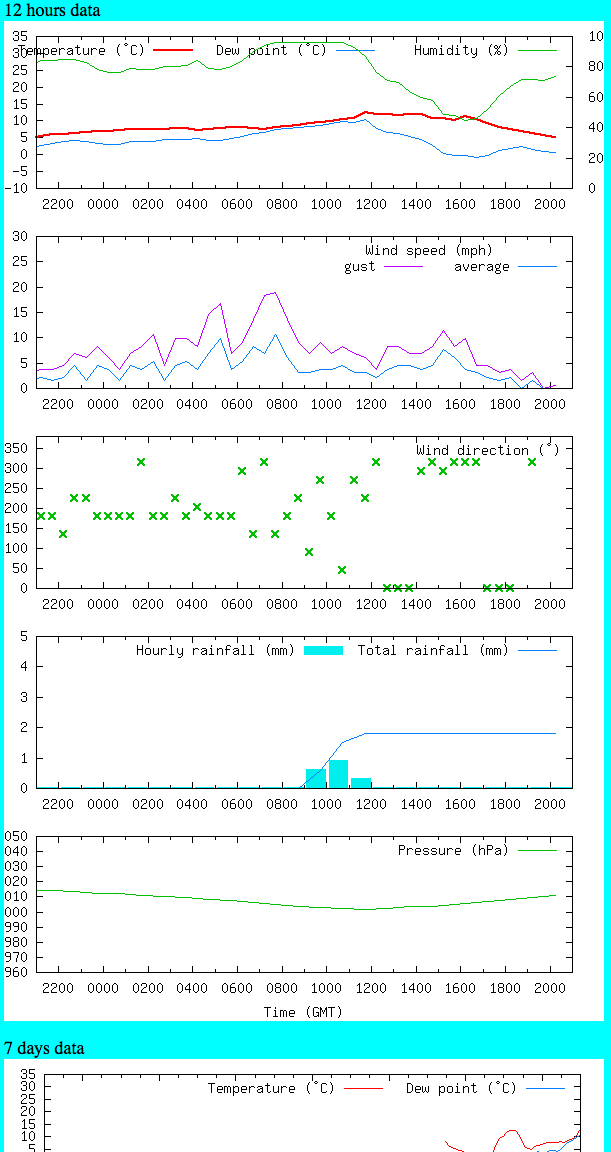
A simple test web page -
<!DOCTYPE HTML PUBLIC "-//W3C//DTD HTML 4.01 Transitional//EN"> 12 hours data<BR> <p><font size="3">Hartwell weather data</font></a></font></p> |
And the web page (it needs some work!) looks like -
Comments? email me